
Procedural Treetop Villages
Overview
Procedural generation is used to create video game spaces non-destructively and can increase variation as infinite unique inputs can generate infinite unique outputs.
For this project, I created a procedural pipeline for generating gameplay spaces that serves as a tool for game designers.
Firstly, a graph evolution web program allows a designer to generate graphs to their liking. Graphs are nodes connected by edges and can represent many game-related concepts. For example, a level represented by a graph could be a dungeon where nodes represent rooms and edges represent the connecting hallways.
The graph generation approach for this project allows the designer to direct the form of graphs through “likes” and “dislikes” while offering the designer new possibilities that can inspire creativity. The tool allows for additional tweaking of graphs once the designer is happy with the result.
Next, a Houdini Digital Asset running in Unreal Engine 4 interprets a graph as a village of treehouses. This is a specific way to interpret the graphs, and it demonstrates how they can be used to generate end-to-end procedural levels.
Introduction
Video game level design consists of many sequential stages. First, a designer sketches level layout ideas on paper. Next, the designer models a simple version of the level (graybox level) that can be playtested. With a finalized graybox level, artists can begin dressing up the level in props, materials, and lighting through multiple sequential passes.
This sequential pipeline is a destructive workflow, as changes in an early stage require labour to perpetuate those changes in later stages. This means that problems spotted in the layout and design stages can be costly and labour intensive to fix if work has started in the level-dressing stage. Lost work means that time and money can be wasted in this traditional destructive workflow.
Procedural level design pipelines offer a remedy to this problem. Changes made to the base design automatically perpetuate to the finalized level. This means that work is less likely to be lost, and level designers and artists can begin work at the same time.
Procedural level design pipelines also offer the benefit of added variation. One level asset can be used to generate infinite unique finalized levels. Being able to see many possible outcomes promotes creativity as the algorithms suggest new ideas and variations.
Additionally, the traditional level design workflow adds pressure for a level design to be perfect prior to art passes. Game design, however, is an organic process. It can be costly to add new features or change artistic direction as entirely new levels may need to be designed to support these changes. With proceduralism, the pressure to create a perfect level from the beginning is removed and level designers can be free to adapt their designs throughout the game creation process.
This generator works in two steps. Each step uses a different procedural approach:
Graph Evolution Method: This interactive tool takes continuous feedback and generates graphs that align with the user’s preferences. Final manual modifications can be made.
Village Generator: Using the graph from step 1, this tool runs in a game engine to build a treetop village gameplay space. The user can manually modify any stage of this process by changing parameters.
Approach
Graph Generation
A graph evolution program takes continuous designer input [Fig. 1] and outputs a desirable 2D graph using a genetic algorithm.
A genetic algorithm iteratively updates generations by creating new organisms with inherited traits from the previous generations [1]. An organism is an object with an array of traits as well as a fitness score. A generation is a set of organisms. For each generation, the n organisms with the highest fitness scores are assigned to a set called the mating pool. Two organisms in the mating pool set become parents of two new child organisms for the next generation. The traits of a child organism are selected from its parent. This step is repeated until the next generation contains the same number of organisms.
A genetic algorithm uses a fitness function to assign objects fitness scores. To incorporate designer preference, a design gallery approach is used similar to [1] . A user is shown the organisms from each generation, and they may “like” or “dislike” an organism which modifies the organism’s fitness score. Fitness scores are inherited from parents.
For this project, the organisms represent force-directed [3] Barabási–Albert graphs [4]. Graphs are randomly initialized with n nodes. The edges are drawn based on the graph’s traits. Additional connections are made to “popular” nodes which already have a high number of connections. Examples of traits are initial numbers of nodes, connection distance threshold, spring strengths, and the influence of popularity.
The user is shown all the graphs from each generation and can influence the graphs’ fitness scores by “liking” or “disliking” each graph. Over time, graphs will converge towards a desirable combination of traits. Random mutations fight complete convergence and present the user with new possibilities to inspire creativity, as is suggested in [1][2].
A user can save a graph and tweak it using the Graph Reader program. These graphs can represent many gameplay concepts such as decisions and dialogue trees, actor behavior and animations, or physical level layouts.
In our case, the graphs are inputs to an asset in Unreal Engine 4 and are used to generate treetop village gameplay spaces.
Treetop Villages
The asset in Unreal Engine 4 takes a graph as an input, and outputs a treetop village gameplay space.
First, the graph is converted to a 3D graph in the game engine [Figure 3]. The designer can modify parameters that influence the shape and look of the 3D graph such as graph dimensions, node scales, degree-based scaling, and node colors.
Next, a tree is grown using a space colonization algorithm [Fig. 3]. A space colonization algorithm takes as an input a starting point and a point cloud of attractor points to iteratively grow the tree towards.
The overall shape of the tree can be modified in-engine via a curve and noise-based displacement. The tree shape is scaled and positioned to fit the 3D graph. Attractor points are spawned within the tree shape. Attractors spawned within graph nodes are labelled essential, meaning branches must pass through these points.
Once the tree has been grown, neighborhood layouts are generated for each node [Fig. 4]. Neighborhoods are clusters of points and lines representing houses and bridges. For each node, house points are spawned on the tree geometry contained within the node. These points are randomly assigned house dimensions, and a relaxation algorithm iteratively spreads the points so houses will not collide. Local neighborhood paths are drawn ensuring each platform is connected to at least one other platform in its neighborhood. Neighborhoods are connected via main paths matching the structure of the initial 3D graph. i.e two neighborhoods are directly connected with a main path if their nodes were connected.
At this point, the level design stages are complete.
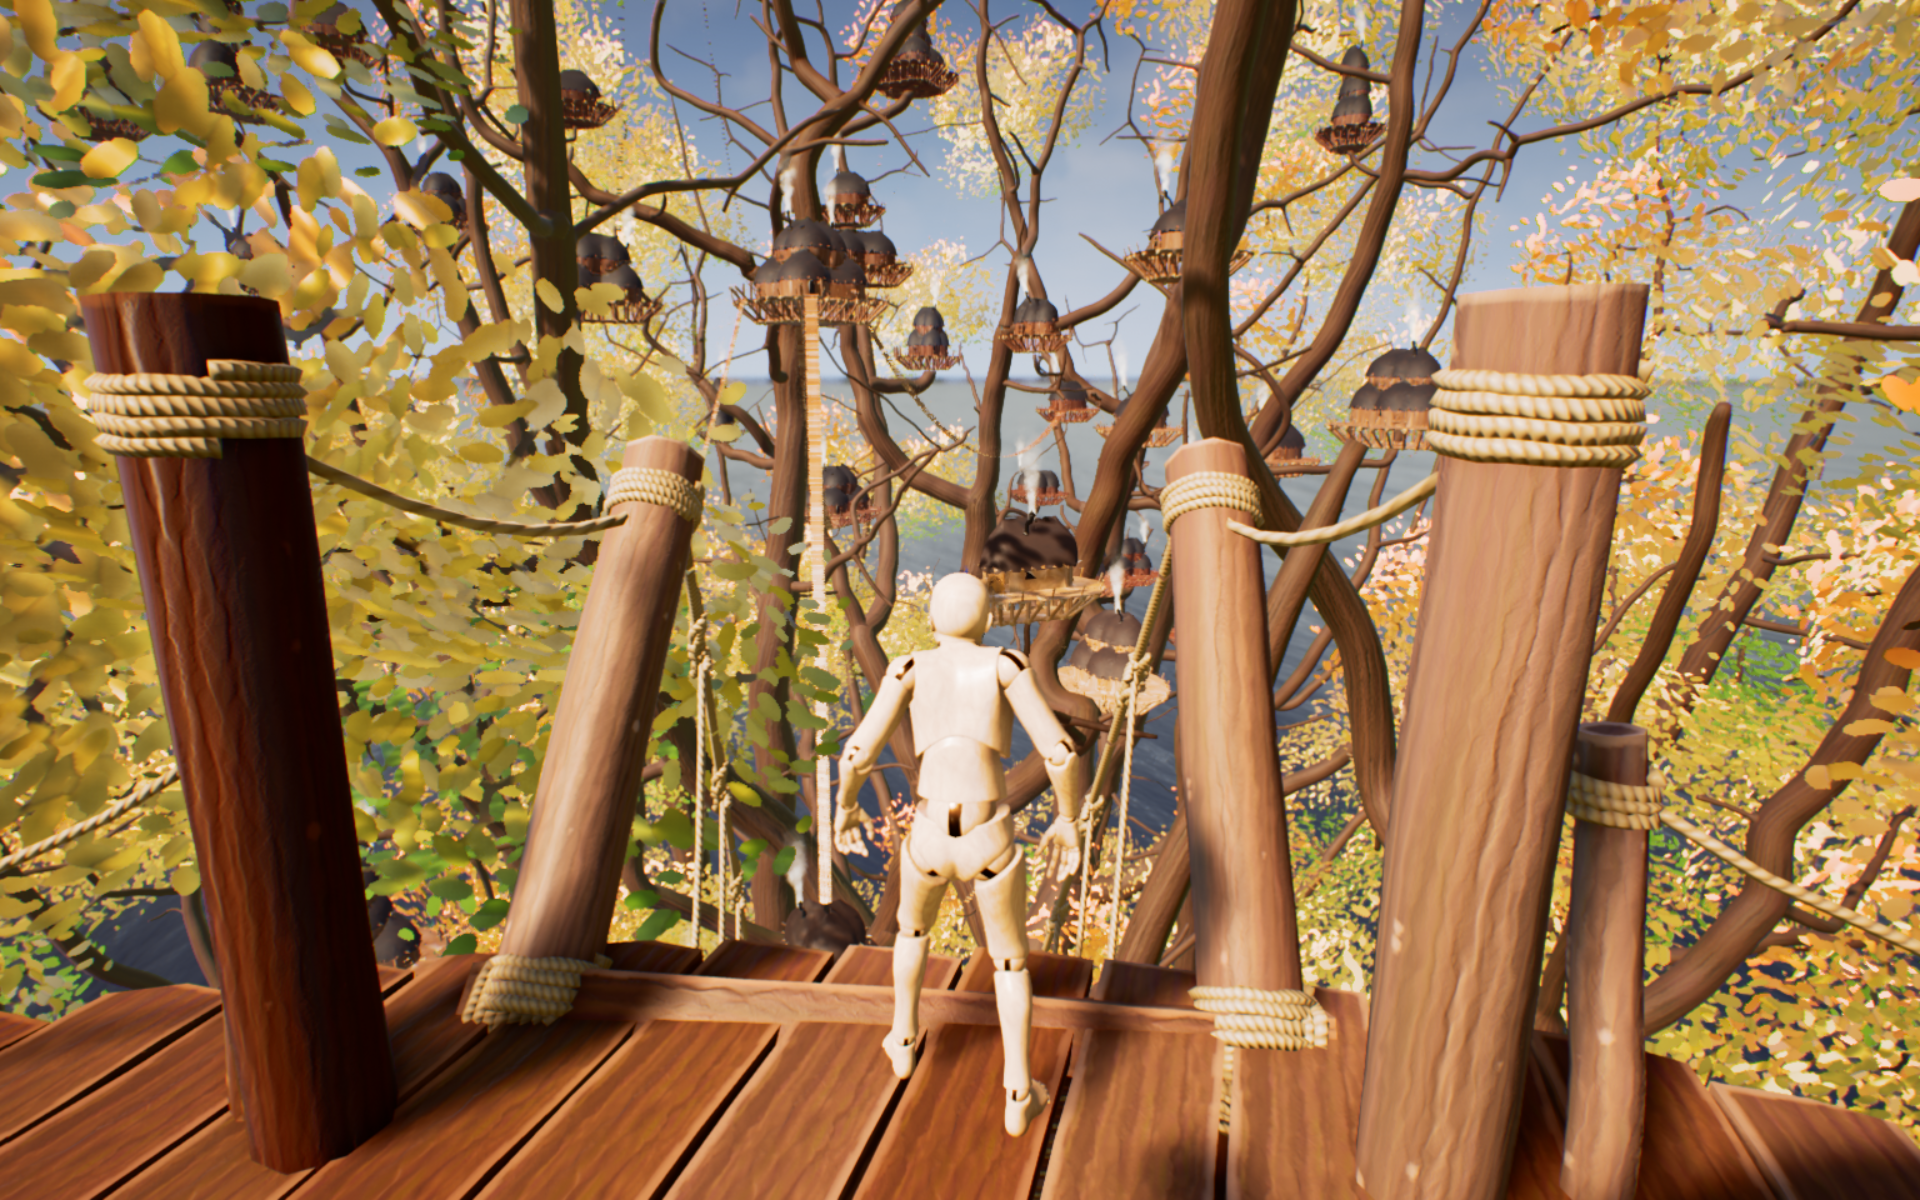
Finally, the last stage generates procedural geometry, assigns materials, and places instances. This stage represents the art passes used in a traditional level design approach.
Precomputed procedural tree houses are assigned to each house point based on dimension parameters. These procedural treehouses are driven by input parameters such as number of wings, number of stories, width, roof height, etc. They are built using procedural modeling techniques and by deforming elements of a modular kit. Bridges are generated using similar techniques. Wood colors are assigned from a color field driven by graph colors assigned in stage 1.
Other procedurally modelled props such as tables, bushes, windmills, lanterns, and doors are instanced into the world. Some of these props, such as bushes and windmills are self-contained procedural assets that can be modified in-engine.
Many props such as windmills, flowers, mugs, and books have shaders which vary color hues based on world location and masks. Animated props such as foliage and windmills utilize world position offsets in their vertex shaders to drive movement. Wood shaders vary wood hue, saturation, and lighness based on texture masks generated in Substance Designer. Lighting elements such as reflection captures and point lights are also spawned using instance points.
LODs are generated procedurally in the Houdini Digital Asset (and are precomputed for houses) using polygon reduction and remeshing functions.
Fig 1: Graph evolution with designer input.
Fig 2: Final graph tweaking
Fig 3: 3D graph generation and space colonization tree.
Fig 4: Neighborhoods from nodes and tree geometry.
Fig 5: Final house and bridge geometry from neighborhood structures.
Graph Evolution Tool
Graphs are versatile and can be used in many game design scenarios. For this project, I used graphs to represent levels in a video game environment.
Instructions: Click the graphs you find interesting. Double click the ones you dislike. When the generation number increases, you should be shown more graphs like those you have selected. Random mutations in each generation will introduce new traits and prevent graphs from becoming stale. Right click a graph you want to download.
Next, graphs can be tweaked to your liking.
Instructions: Load a graph downloaded from the graph evolver. Use sliders to modify graph, and press save to download.
References
[1] Kai Xu, Hao Zhang, Daniel Cohen-Or, and Baoquan Chen. 2012. Fit and diverse: set evolution for inspiring 3D shape galleries. ACM Trans. Graph. 31, 4, Article 57 (July 2012), 10 pages. DOI:https://doi.org/10.1145/2185520.2185553
[2] Gad, A. (2018, July 3). Introduction to optimization with genetic algorithm. Medium. Retrieved March 29, 2022, from https://towardsdatascience.com/introduction-to-optimization-with-genetic-algorithm-2f5001d9964b
[3] Tamassia, R. (2010). Chapter 12: Force-Directed Drawing Algorithms. In Handbook of Graph Drawing and visualization. essay, Chapman & Hall.
http://cs.brown.edu/people/rtamassi/gdhandbook/chapters/force-directed.pdf
[4] Wikimedia Foundation. (2022, March 21). Barabási–Albert Model. Wikipedia. Retrieved March 29, 2022, from https://en.wikipedia.org/wiki/Barab%C3%A1si%E2%80%93Albert_model